DOT/USD – DOT Setting Fresh ATH Above $11.
Key Support Levels: $12, $11.60, $11. Key Resistance Levels: $13, $13.37, $14.08.
DOT started to surge higher toward the end of 2020 when it bounced from support at $4.50 (100-days EMA) to reach $9.65 by the end of the year. In 2021, it struggled to break resistance around $10.20 for the first week of January and eventually rolled over earlier this week to drop into the $8.00 support.
From there, the cryptocurrency rebounded yesterday as it broke above $10 to meet the resistance at $10.95 (1.272 Fib Extension). Today, the price hike continued as DOT surged past $12 to reach $12.72.

DOT/USD Daily Chart. Source: TradingView
DOT-USD Short Term Price Prediction
Looking ahead, if the buyers break $13, the first level of resistance lies at $13.37 (1.272 Fib Extension). This is followed by $14.08 (1.414 Fib Extension), $15.10 (1.618 Fib extension), and $15.70 (1.414 Fib Extension – blue).
On the other side, the first level of support lies at $12. This is followed by $11.60, $11, and $10. Beneath $10, added support is found at $9.65 (.382 Fib), $9.00, and $8.67 (.5 Fib).
The RSI is approaching overbought conditions but still has room to allow the market to push higher before becoming extremely overbought.
DOT/BTC – Bulls Break December Highs At 32,900 SAT.
Key Support Levels: 32,900 SAT, 30,000 SAT, 27,400 SAT. Key Resistance Levels: 35,000 SAT, 37,500 SAT, 39,225 SAT.
Against Bitcoin, DOT also rebounded toward the end of 2020 after reversing from 20,000 SAT to reach as high as 32,900 SAT (bearish .382 Fib Retracement). DOT could not pass this resistance in early-January, which resulted in the coin falling as low as 21,120 SAT (.786 Fib Retracement) this week.
From there, DOT rebounded and started to push higher from Tuesday. Today, it continued above the 30,000 SAT mark and pushed above the December resistance at 32,900 SAT to reach 33,400 SAT.
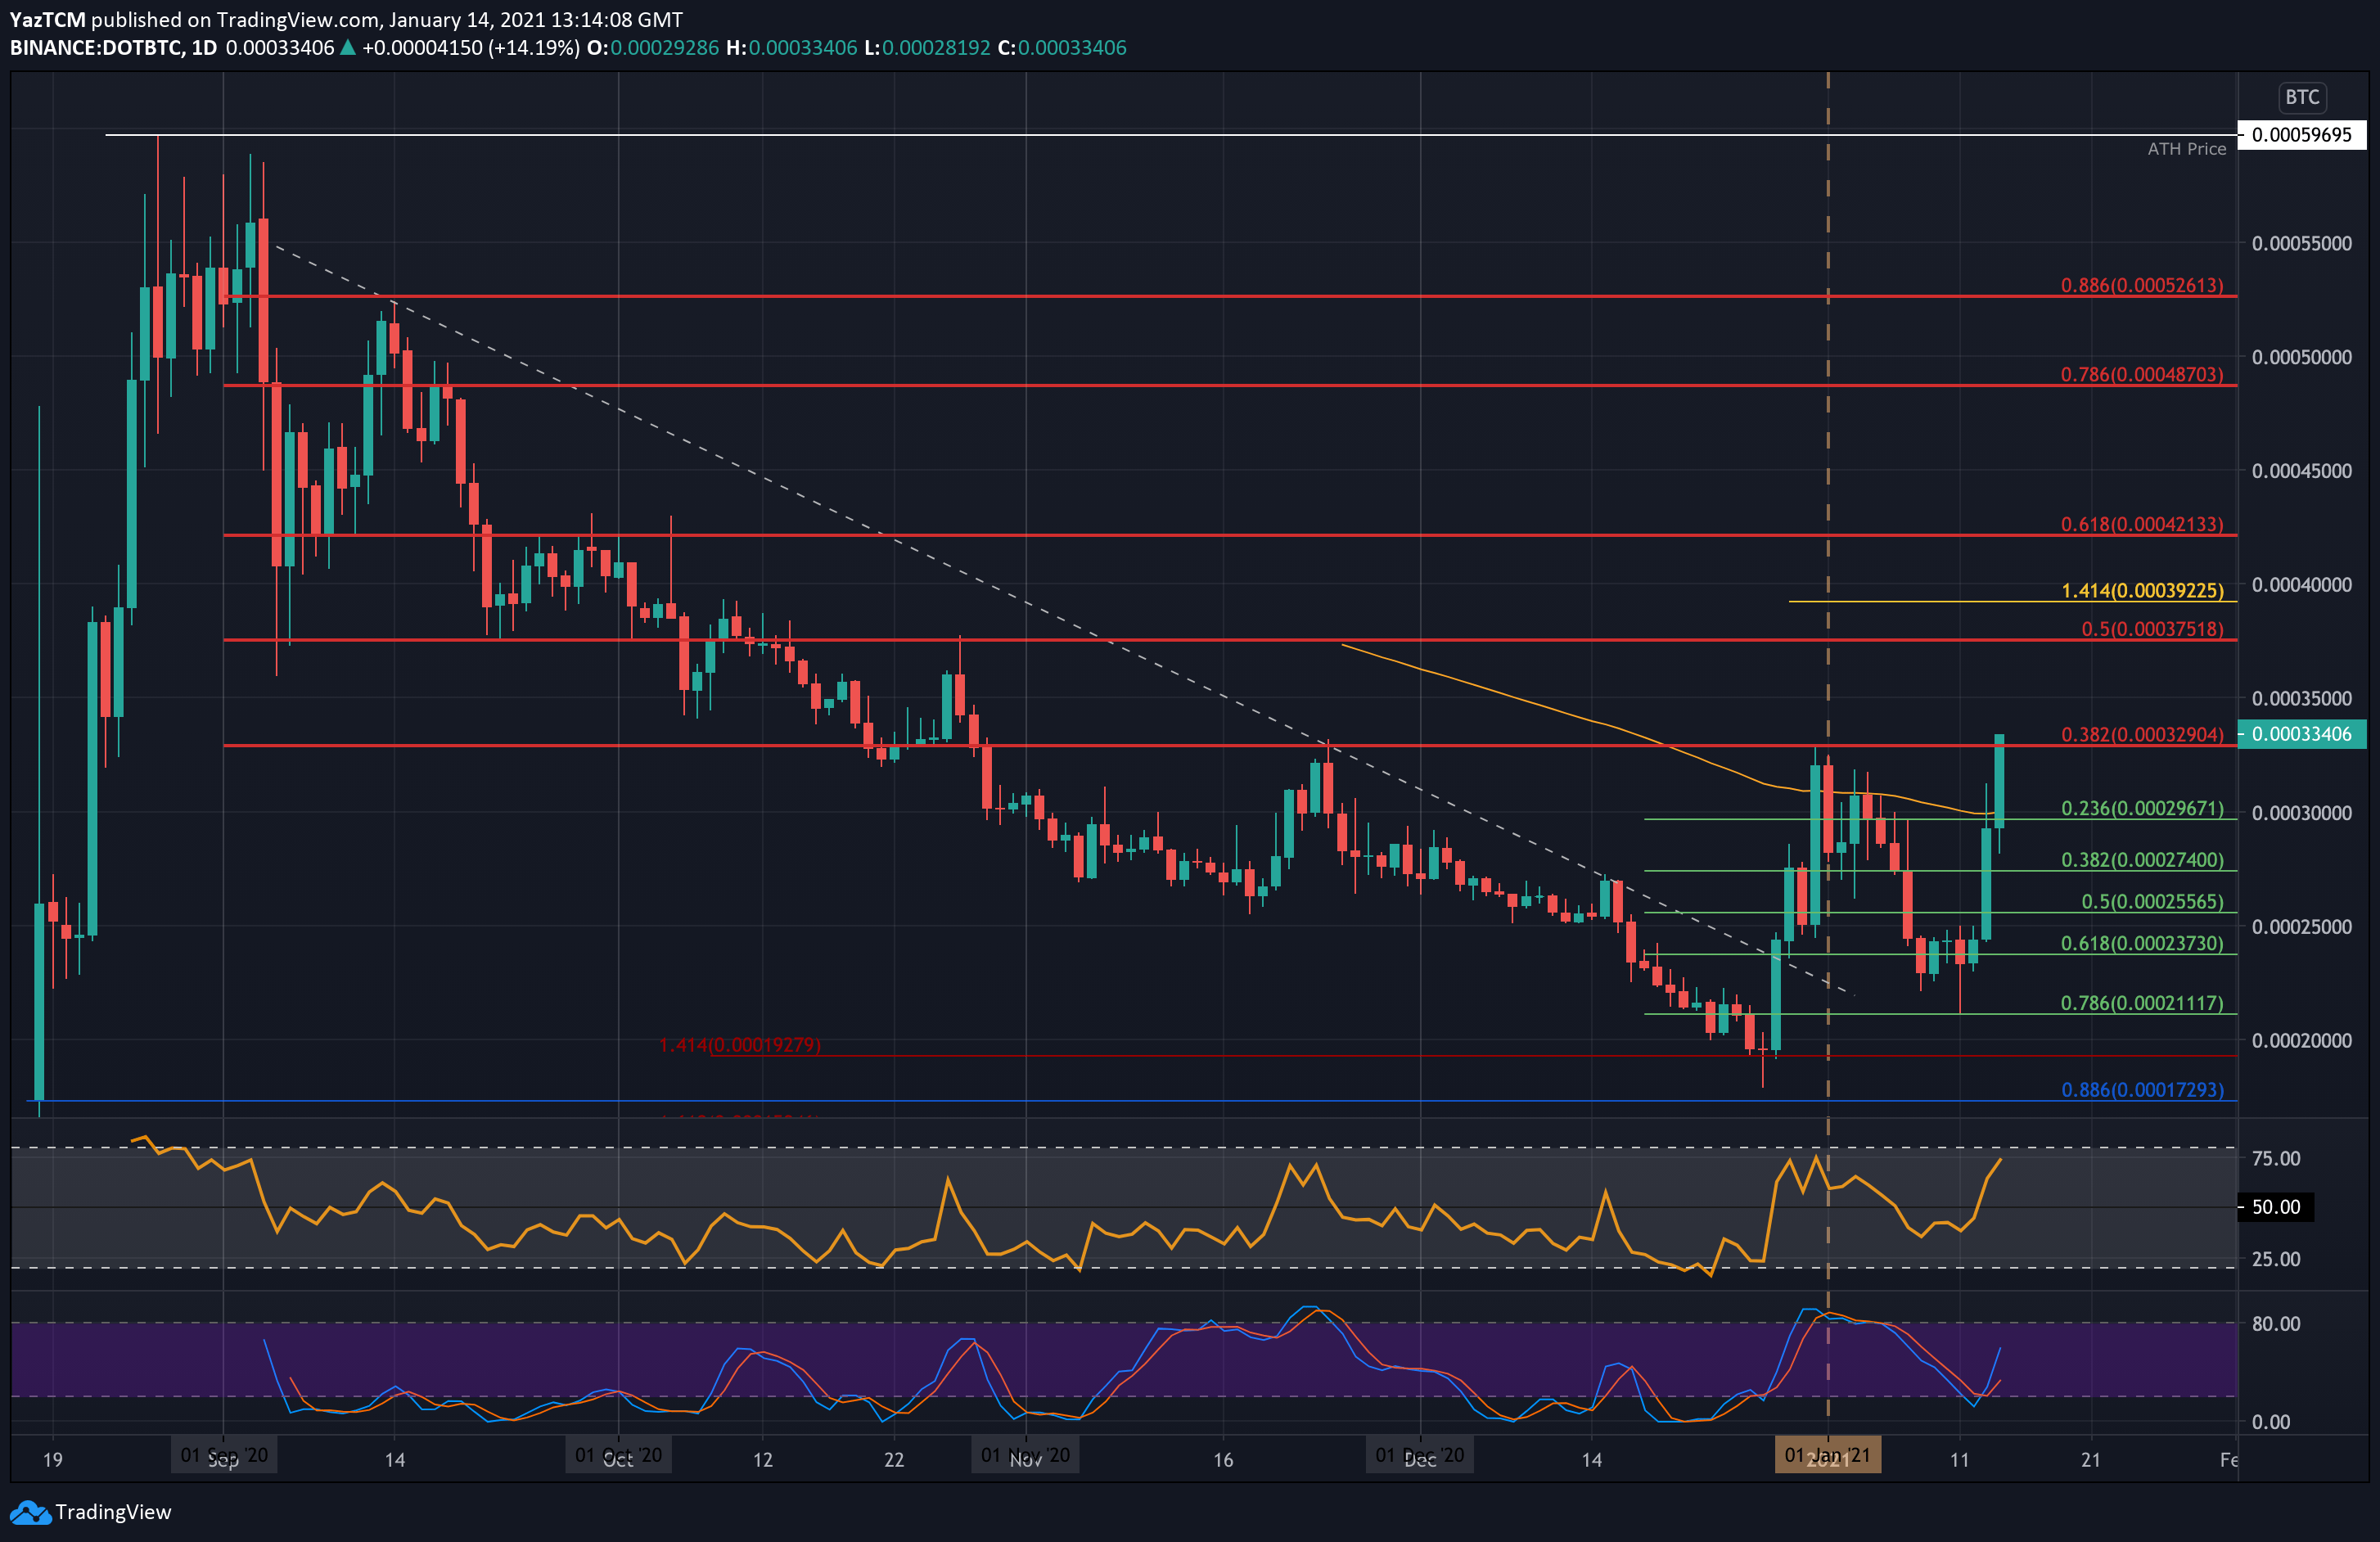
DOT/BTC Daily Chart. Source: TradingView
DOT-BTC Short Term Price Prediction
Looking ahead, if the buyers continue upward, the first level of resistance lies at 35,000 SAT. This is followed by 37,500 SAT (bearish .5 Fib), 39,225 SAT (1.414 Fib Extension), and 42,130 SAT (bearish .618 Fib Retracement).
On the other side, the first level of support lies at 32,900 SAT. This is followed by 30,000 SAT (100-days EMA & .236 Fib), 27,400 SAT (.382 Fib), and 25,565 SAT (.5 Fib).
The RSI is also pushing higher but is still not yet overbought. Additionally, the Stochastic RSI only recently produced a bullish crossover signal and has room to continue much higher.
Title: Polkadot Price Analysis: DOT Surges 40% to a New ATH, Becoming the 5th Largest CryptocurrencySourced From: cryptopotato.com/polkadot-price-analysis-dot-surges-40-to-a-new-ath-becoming-the-5th-largest-cryptocurrency/
Published Date: Thu, 14 Jan 2021 13:49:41 +0000
No comments:
Post a Comment